Wave spectral density (calculation)
Sea state modeling
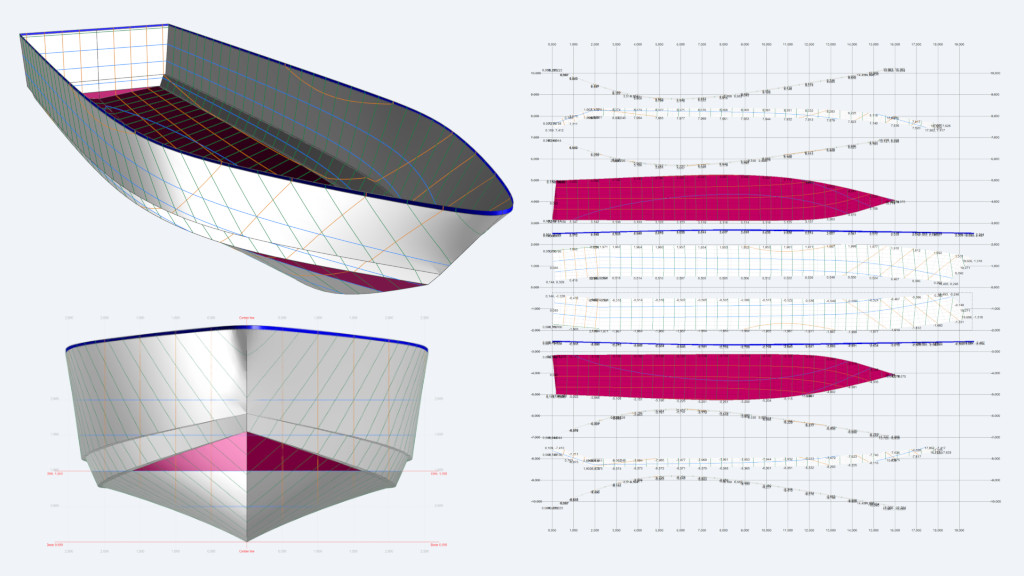
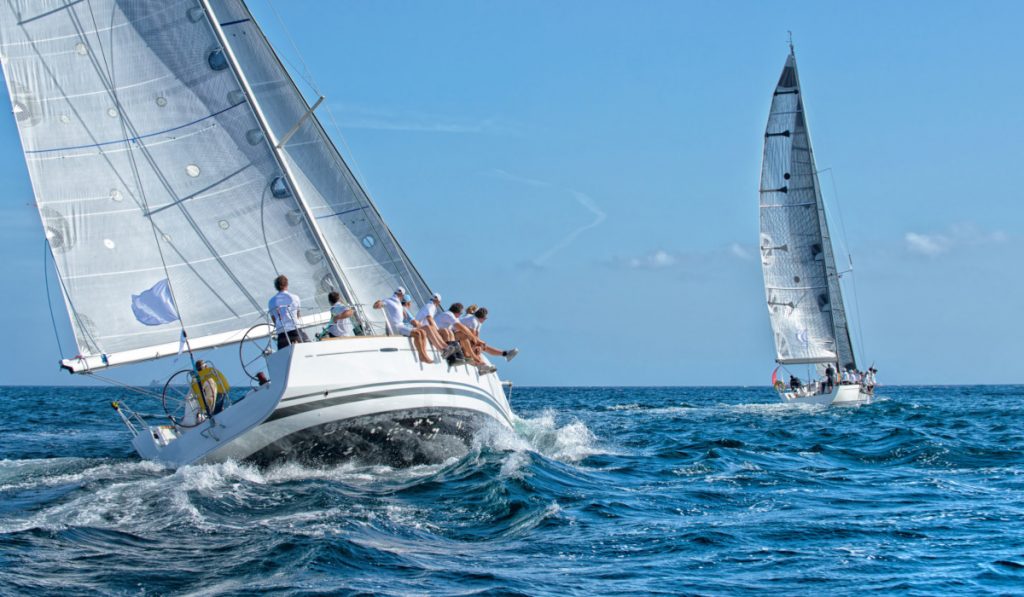
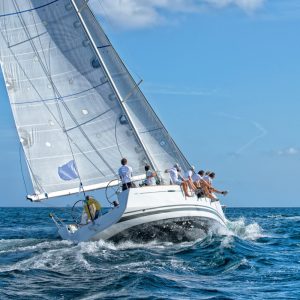
The performance of a sailing boat is affected by the presence of surface waves. To understand the boat’s behavior under waves, it is necessary first to model the irregular shape of the water’s surface.
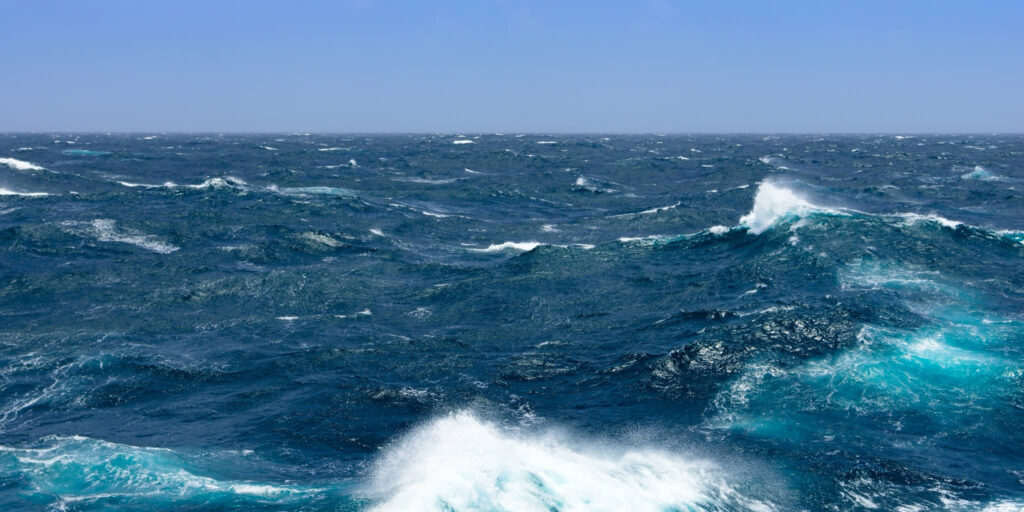
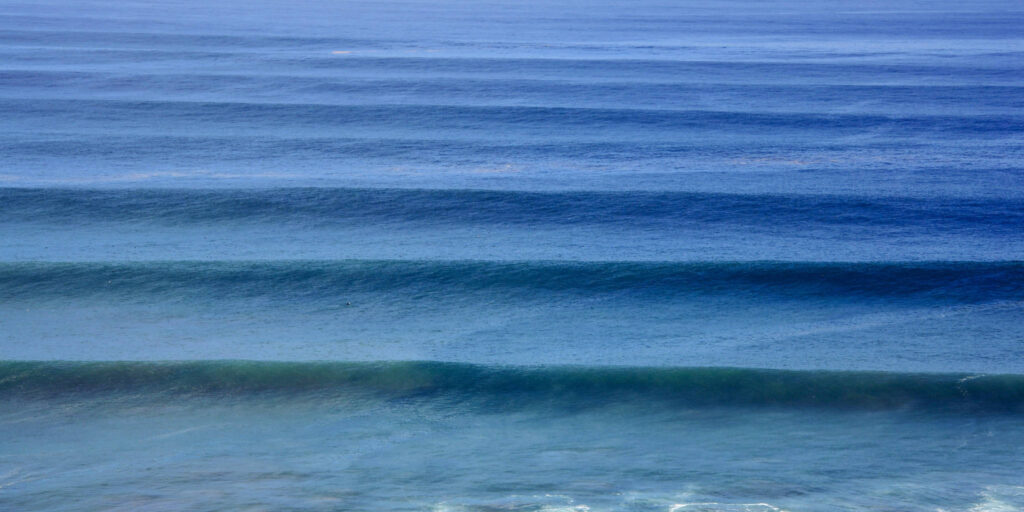
We call sea state the general condition of the free surface of the sea with respect to wind waves and swell at a certain location, a certain time, and for a time interval in which the sea state can be considered to be constant.
The sea state depends on several factors, such as wind speed, wind direction, wind duration (the time since the wind started to blow), water depth, and fetch (distance over which a wind acts without obstruction to produce waves). Based on the energy balance between the local wind and the waves, the sea can be considered as a fully developed, developing, and non-fully developed sea.
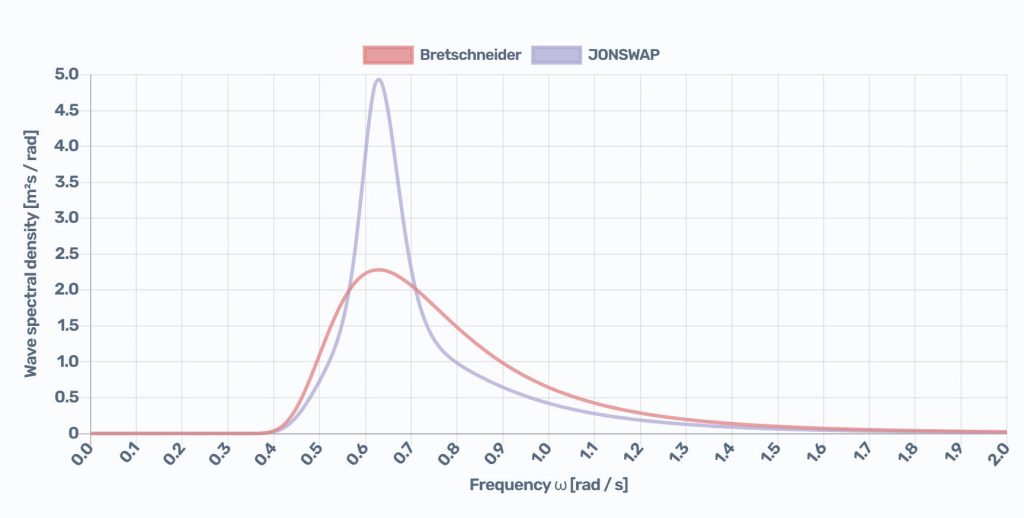
The most common method used for describing the sea state is through the “wave spectral density, “also known as “wave energy spectrum, “or simply “spectrum.” where a particular measure of the wave height is represented based on its angular frequency.
For most ship, offshore structures, and boat applications, two main single-modal spectra (for pure wind waves or swell-only cases) are used:
- Bretschneider spectrum for fully developed seas;
- JONSWAP spectrum for fetch-limited situations.
Both the Bretschneider and the JONSWAP spectrums can be characterized by two parameters:
- The significant wave height, H1/3, and
- The modal period, T0, also known as the peak period.
Wave forecasting
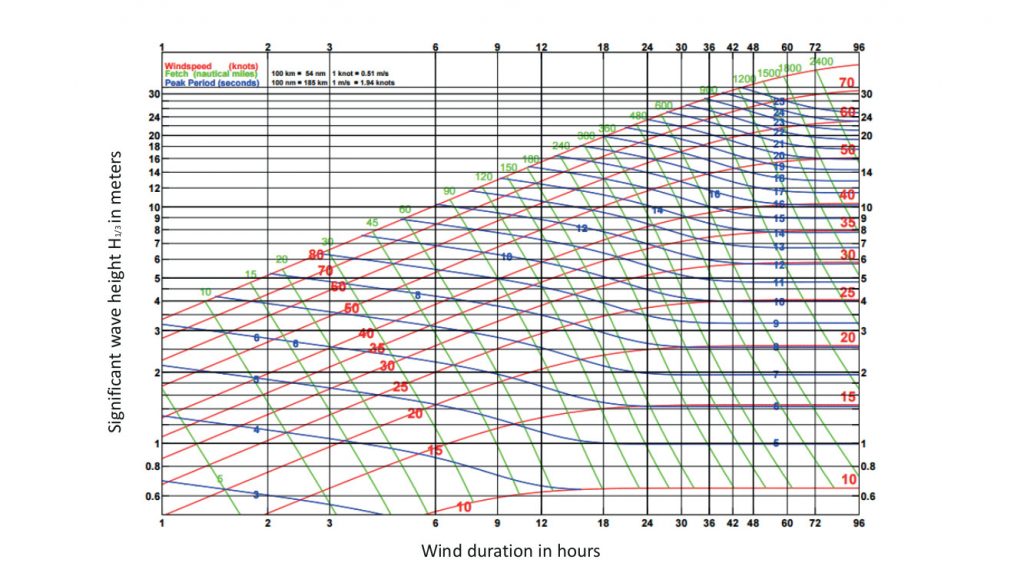
In deep water, the significant wave height, H1/3, and the modal or peak period, T0, of a sea state can be estimated with the Breugem and Holthuijsen wave growth nomogram, where:
- red lines represent the growth of waves along an increasing fetch and correspond to a constant wind speed;
- green lines represent the fetch in nautical miles;
- the vertical lines indicate the duration in hours at which that stage of development will be reached from zero wave height.
For a given wind speed, fetch, and wind duration, the significant wave height, H1/3 (in meters), is obtained from the horizontal black lines, and the modal or peak period, T0 ( in seconds), is obtained from the blue lines in the nomogram.
See also:
- Added resistance in waves: Response Amplitude Operator (calculation).
- Added resistance in waves of a yacht (calculation).
- Added resistance in waves knowing yacht’s radius of gyration (calculation).
- Sea state and wave forecasting.
- Wind-generated sea waves.
- Surface waves.
- The air-water interface.
References:
Some of the links shown below are affiliate links and we may earn a commission at no additional cost to you: